C. elegans drug response
A hundred Caenorhabditis elegans worms belonging to two different strains (StrainA and StrainB) were submitted to two different treatments (T1 and T2) along the course of six weeks. The experimental design is summarized in the table below:
n |
Strain |
Treatment |
100 |
StrainA |
T1 |
100 |
StrainA |
T2 |
100 |
StrainB |
T1 |
100 |
StrainB |
T2 |
This tutorial will use Kaplan-Meier survival curves and a Cox proportional hazards model to assess the effect of treatments T1 and T2 on strains StrainA and StrainB.
Dataset
The templates/survival_data_collection.xlsx spreadsheet was used to collect counts of Dead/Censored C. elegans along the course of the experiment.
The resulting dataset is found in the data/tutorial_data.xlsx file.
If not done yet, open the data/tutorial_data.xlsx to check the format.
Note: There are two sheets - see templates/survival_data_collection.xlsx for details.
Analysis
To fit the Kaplan-Meier survival curves and a Cox proportional hazards model, run the bin/build_survival_curves.R script in a terminal.
Using the --model "Strain+Treatment" option will specify an additive linear model using “Strain” and “Treatement” as covariates.
These covariates were specified in the experimental_model sheet of the data/tutorial_data.xlsx file.
$ bin/build_survival_curves.R --input_fp data/tutorial_data.xlsx --model "Strain+Treatment" --output_dir data/tutorial_results --fig_dir figs/tutorial_results
Results
The results should look like:
survival_analysis
|── data
|   └── tutorial_results
|       |── survival_data.txt            A tidy data table
|       |── survival_data.txt-PRISM.txt  PRISM.txt - A data table in a Graphpad Prism-compatible format
|       |── coxph.txt                    The results of the Cox regression analysis
|       └── km.txt                       A data table of variable for the Kaplan-Meier model
└── figs
    └── tutorial_results
        |── survival_data.pdf            The figures, including survival curves
        └── survival_data.rds            The figures data in RDS format
The figures are found in the figs/tutorial_results/survival_data.pdf file:
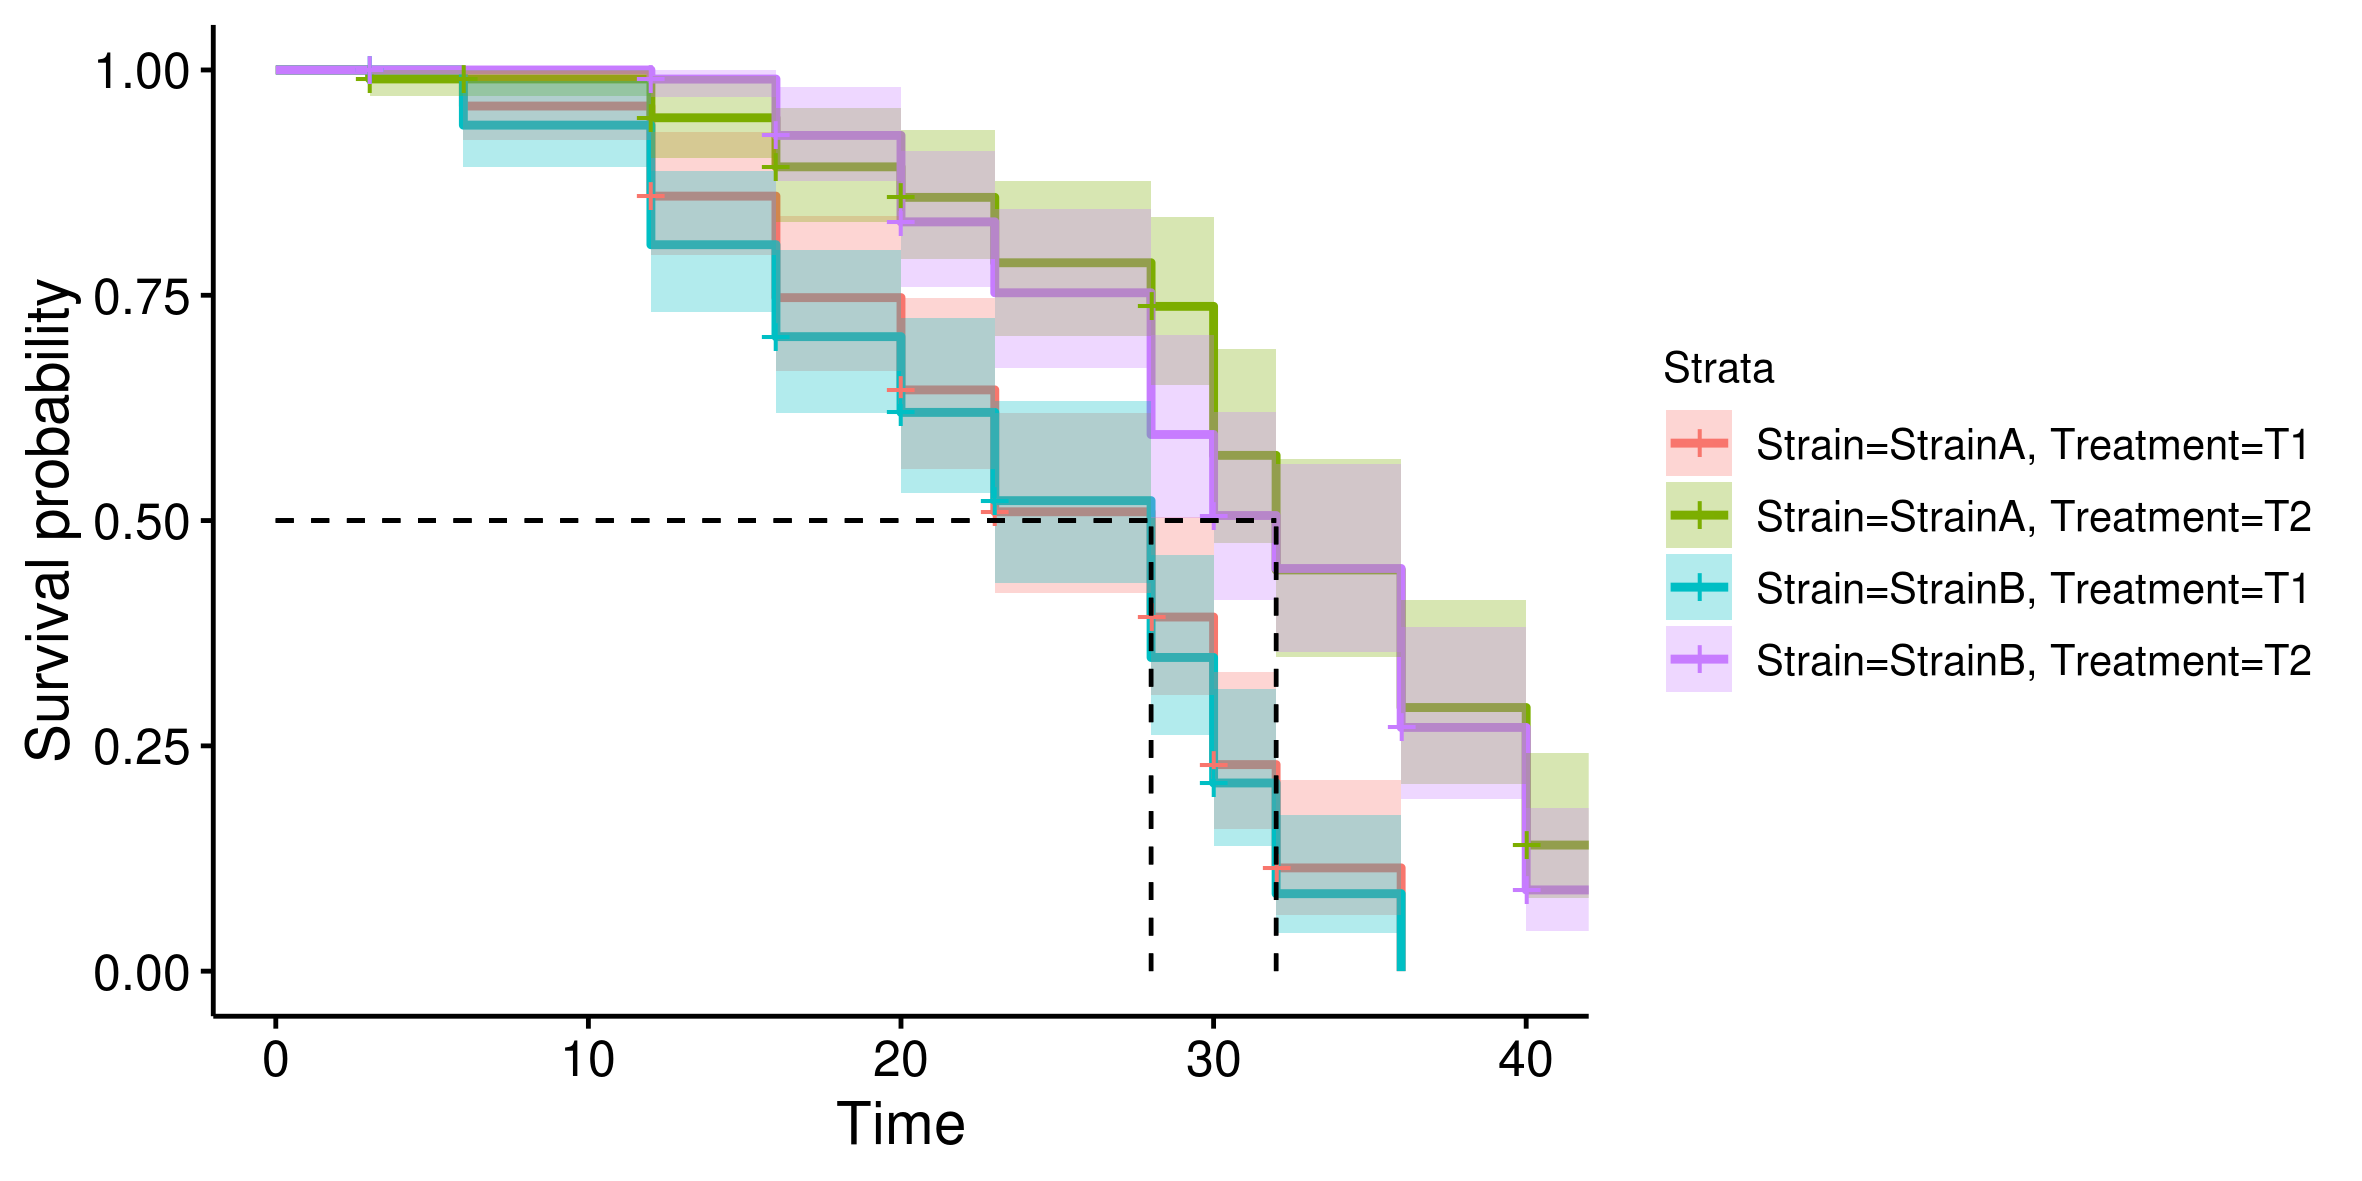
Kaplan-Meier survival curves for each experimental group:
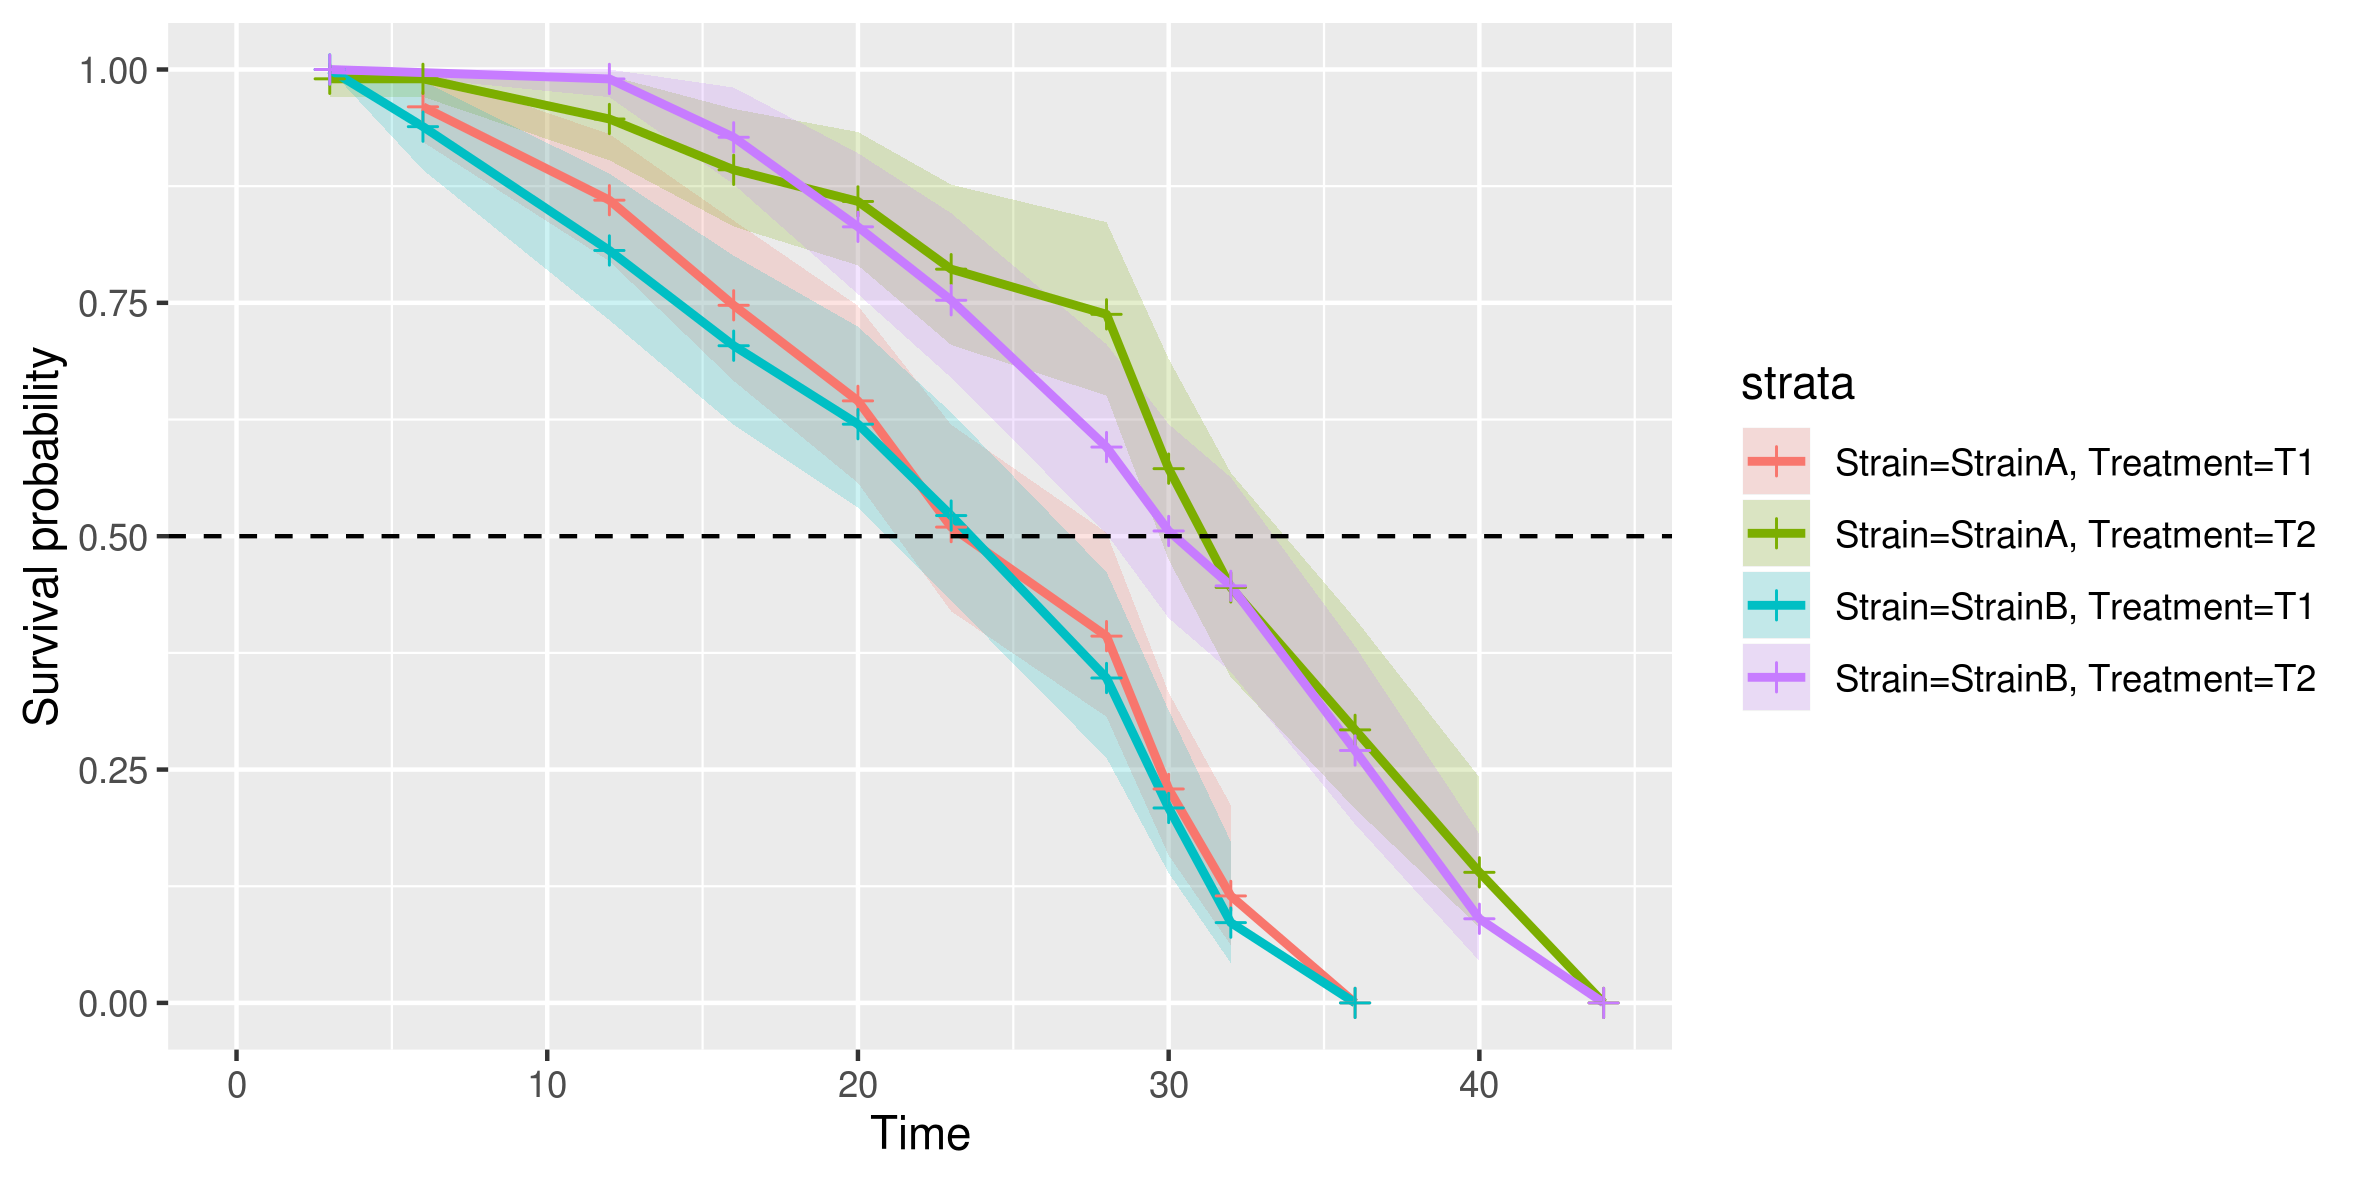
A “linearized” version of the Kaplan-Meier survival curves, for visualization purposes:
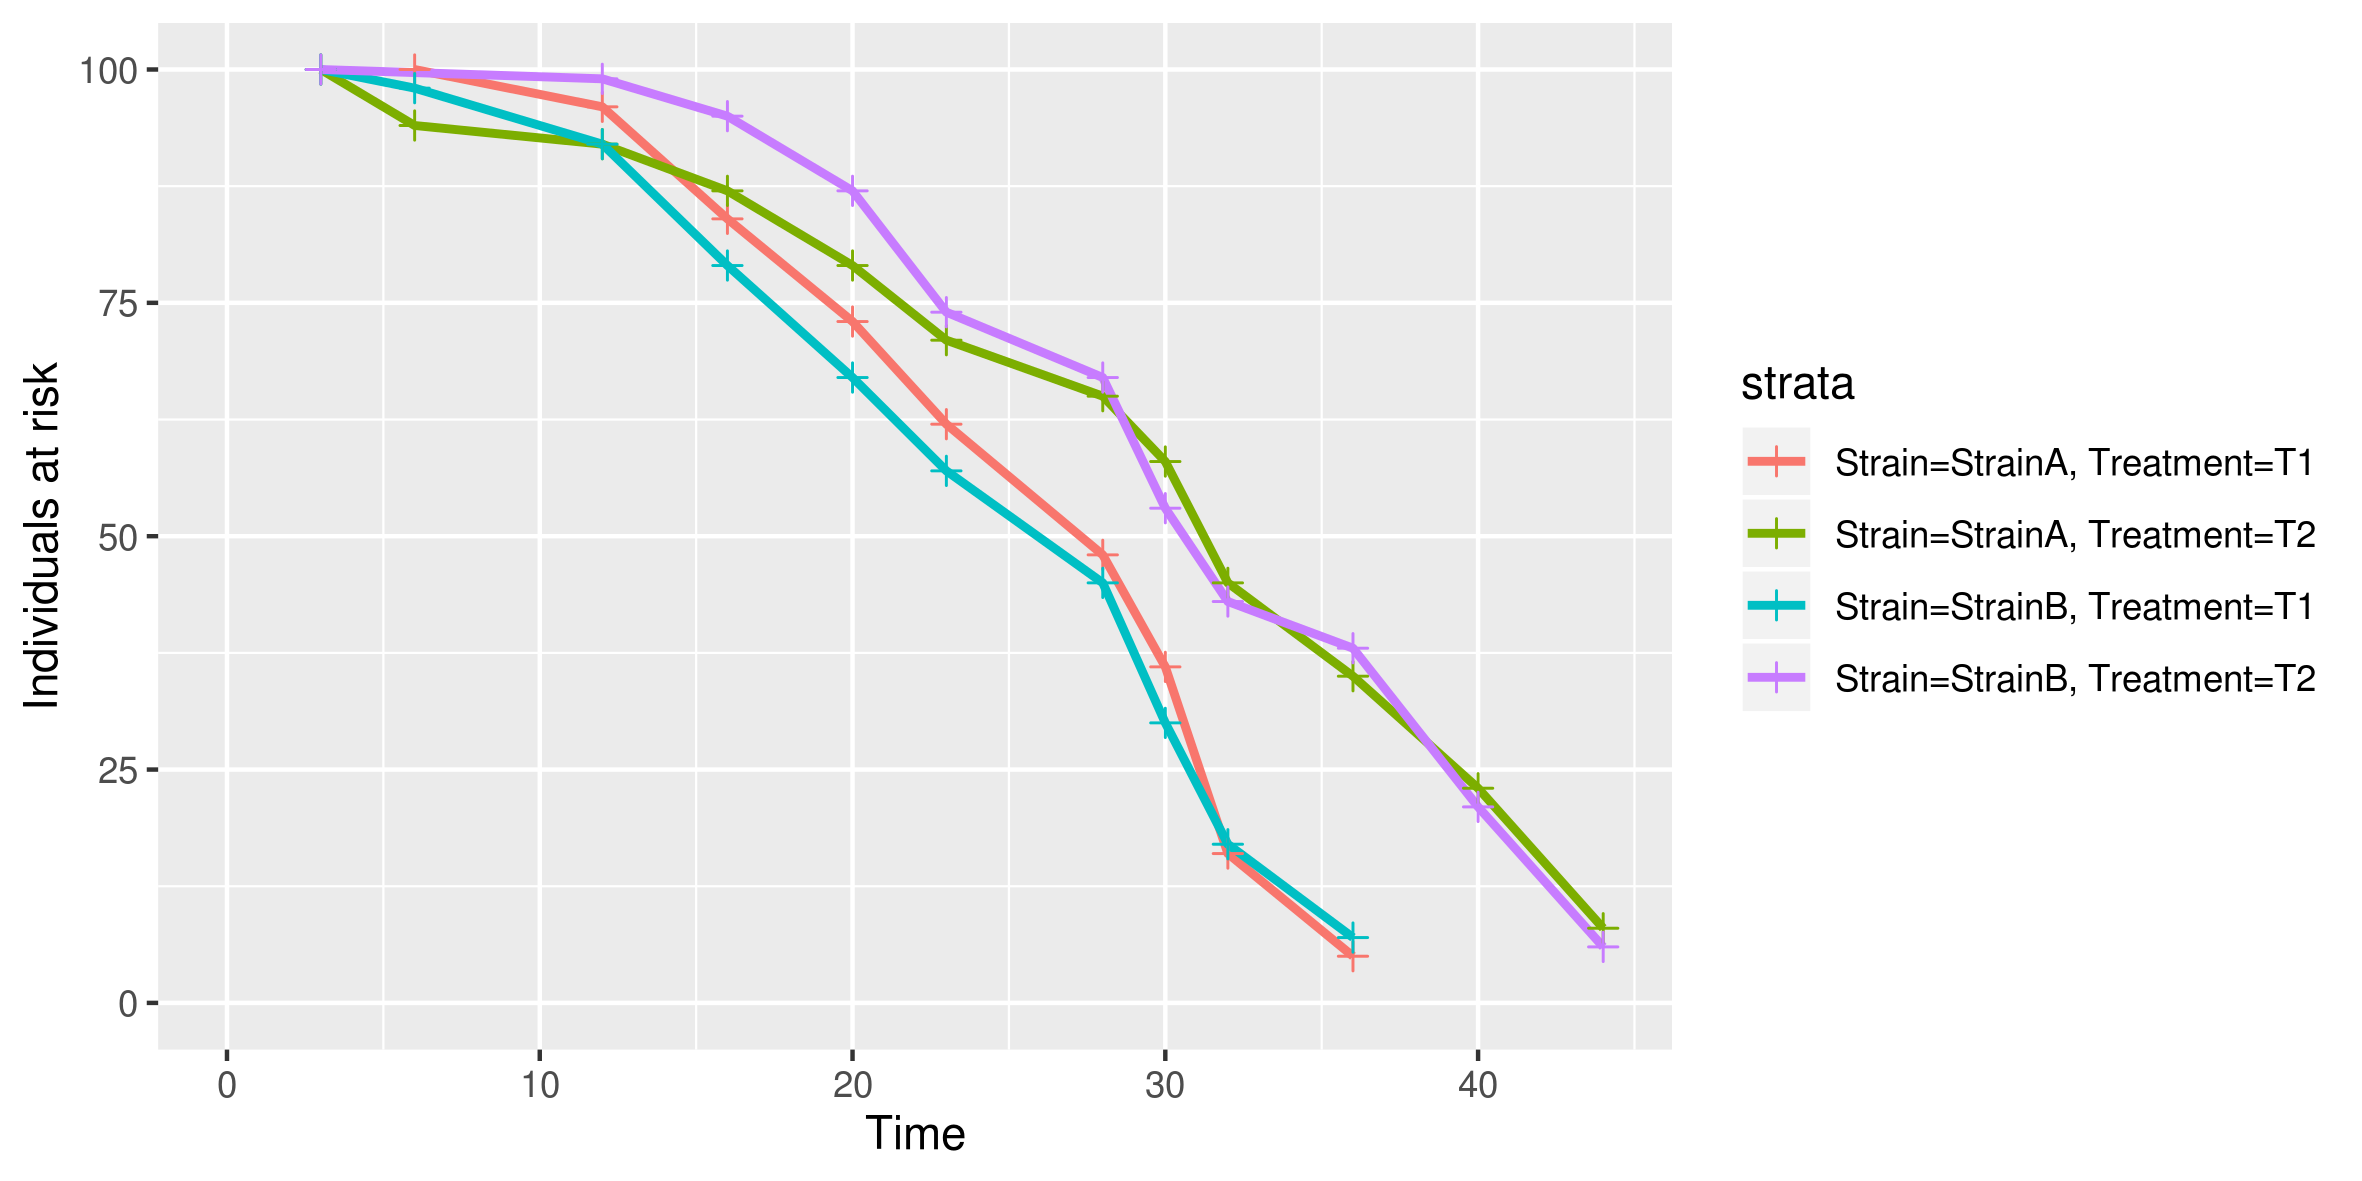
The number of individuals at risk for each experimental group:
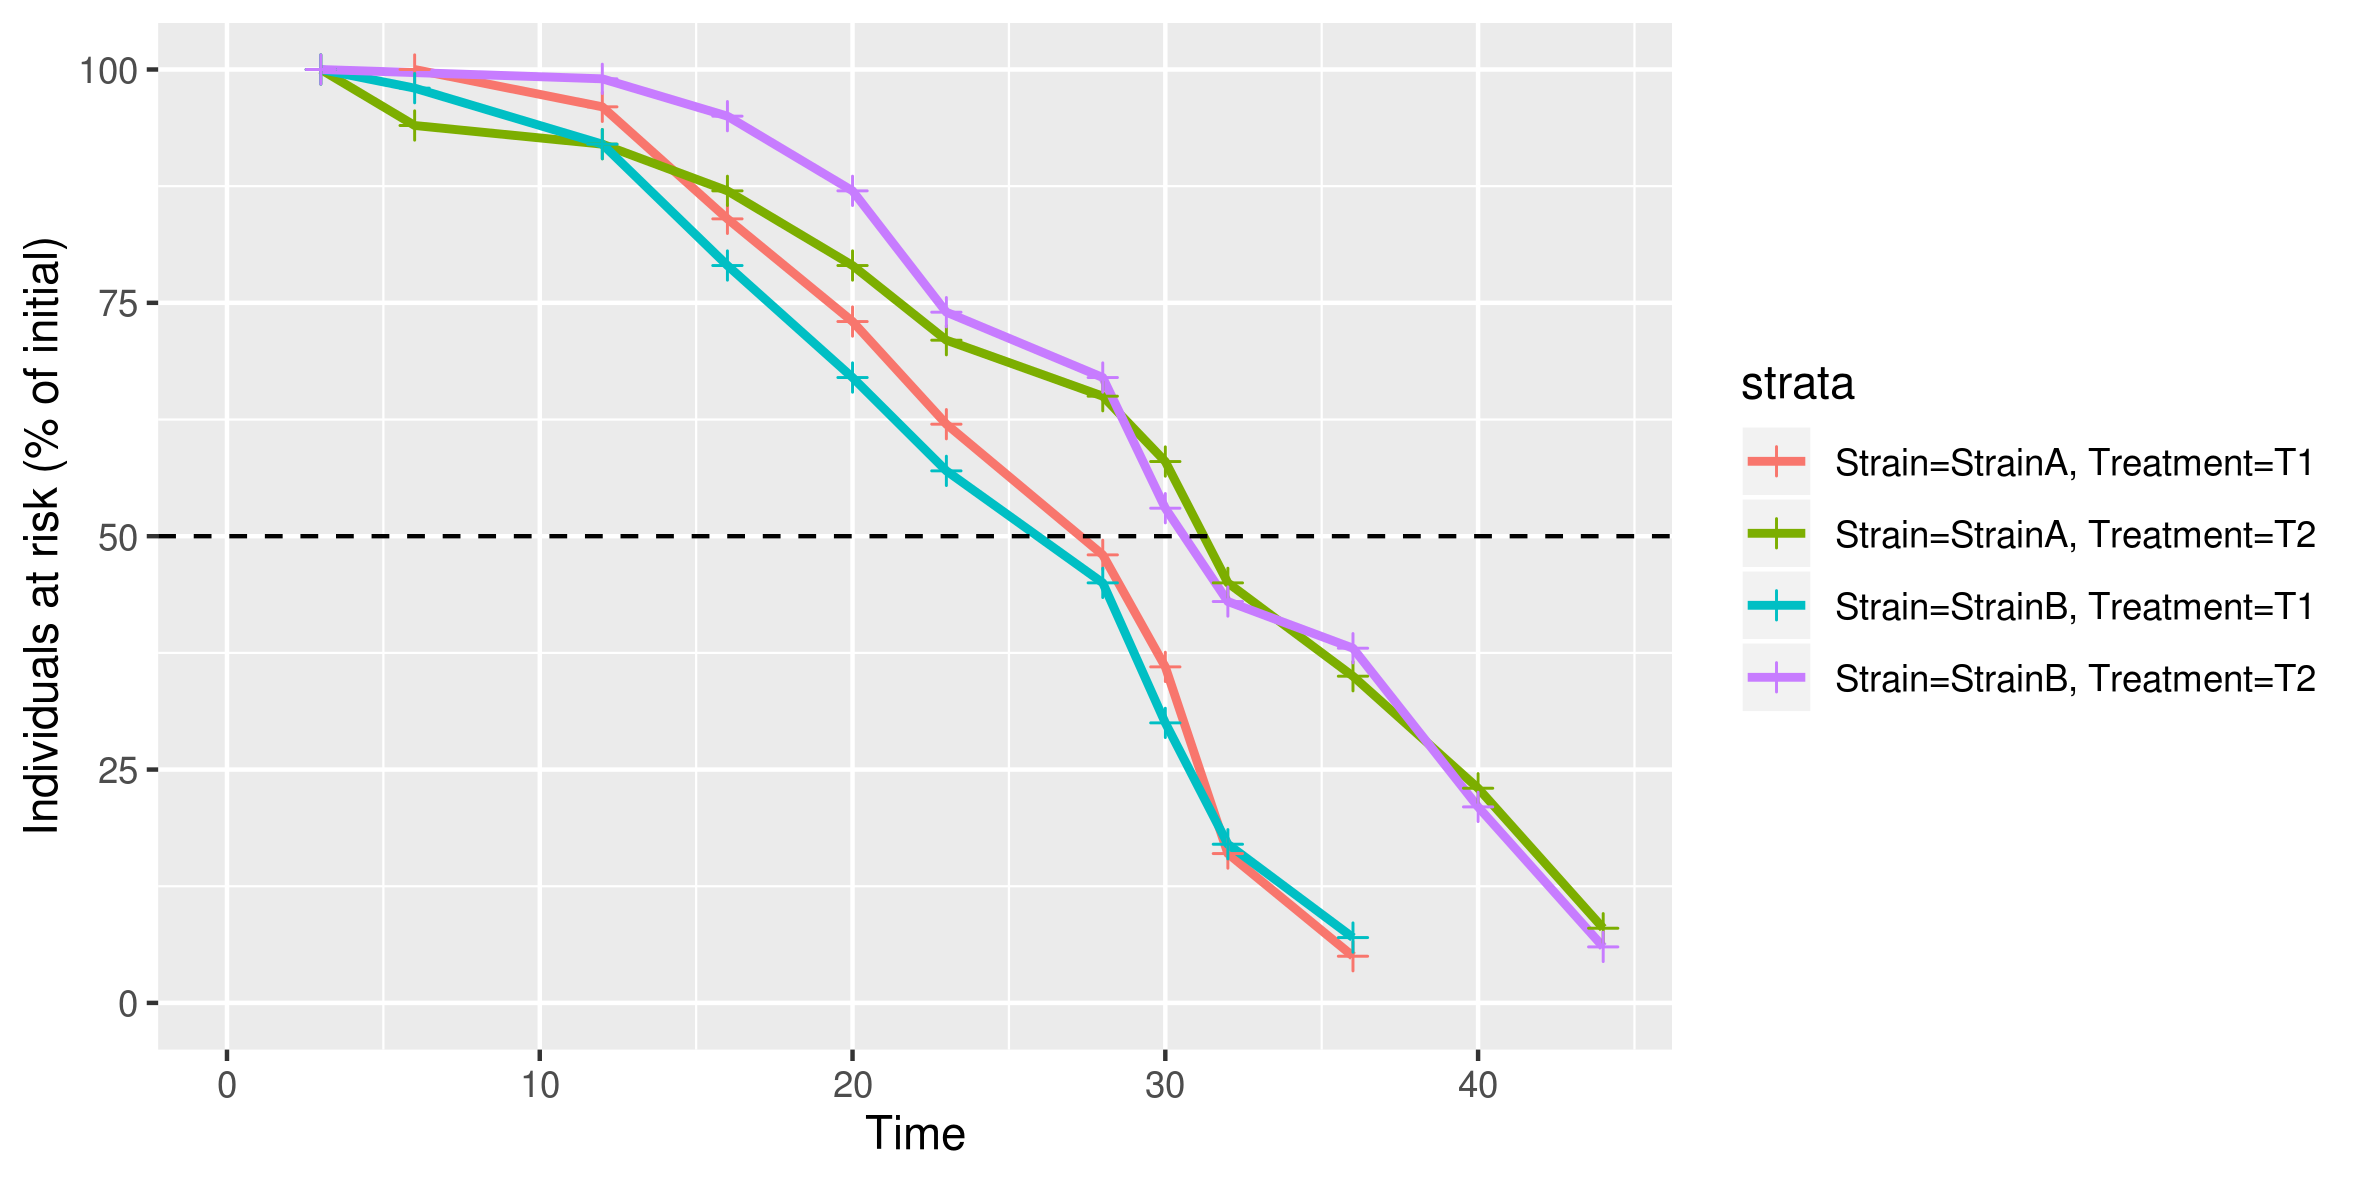
The number of individuals at risk as a percentage of initial experimental group size:
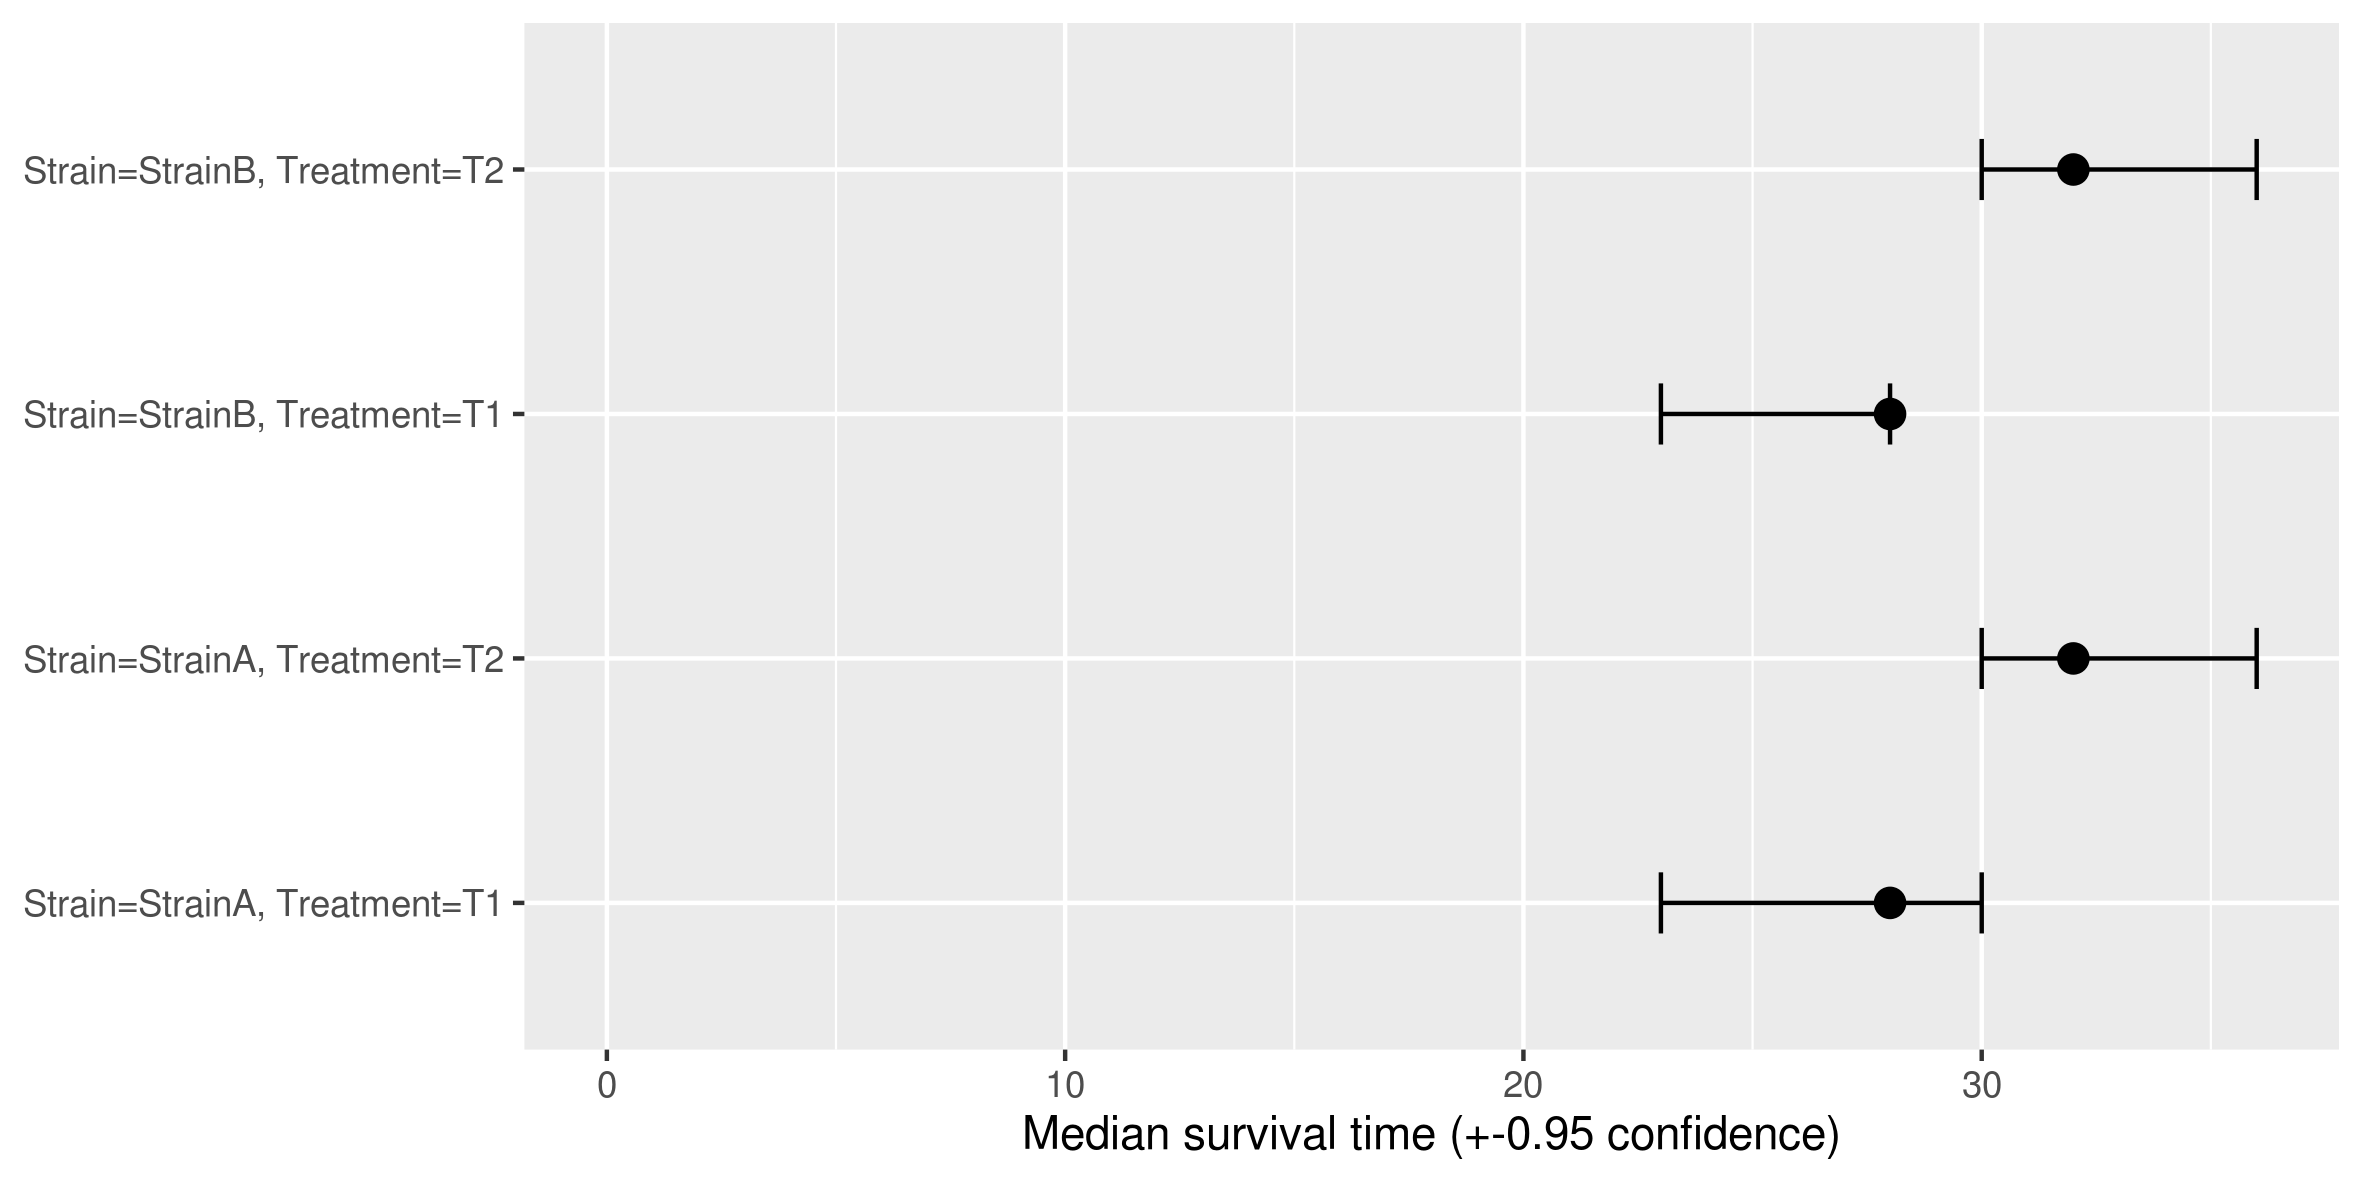
The median survival time for each experimental group:
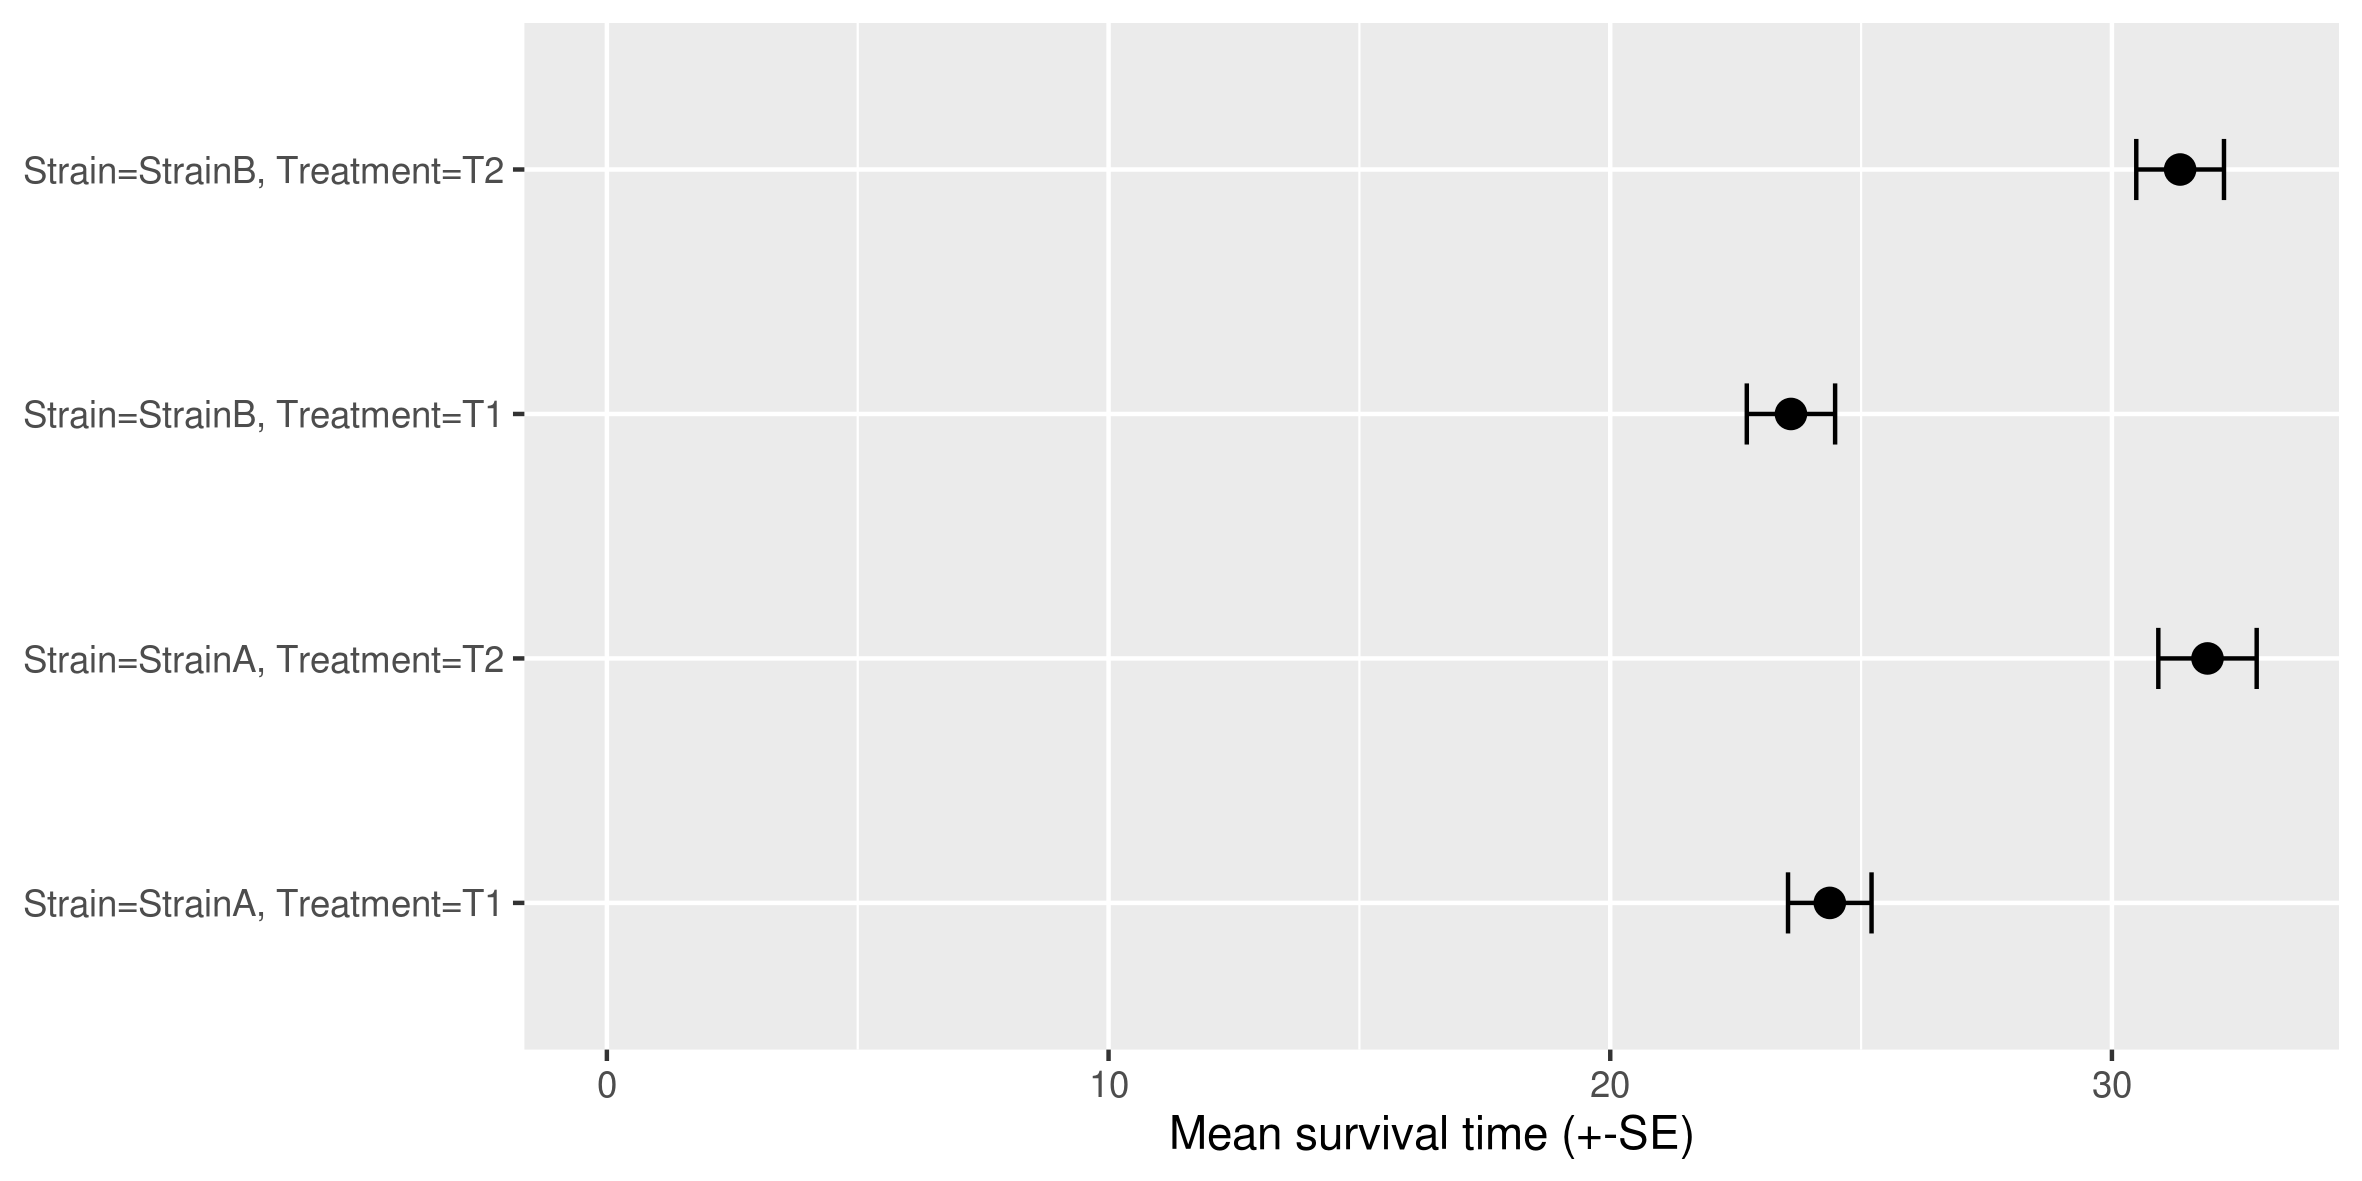
The mean survival time for each experimental group:
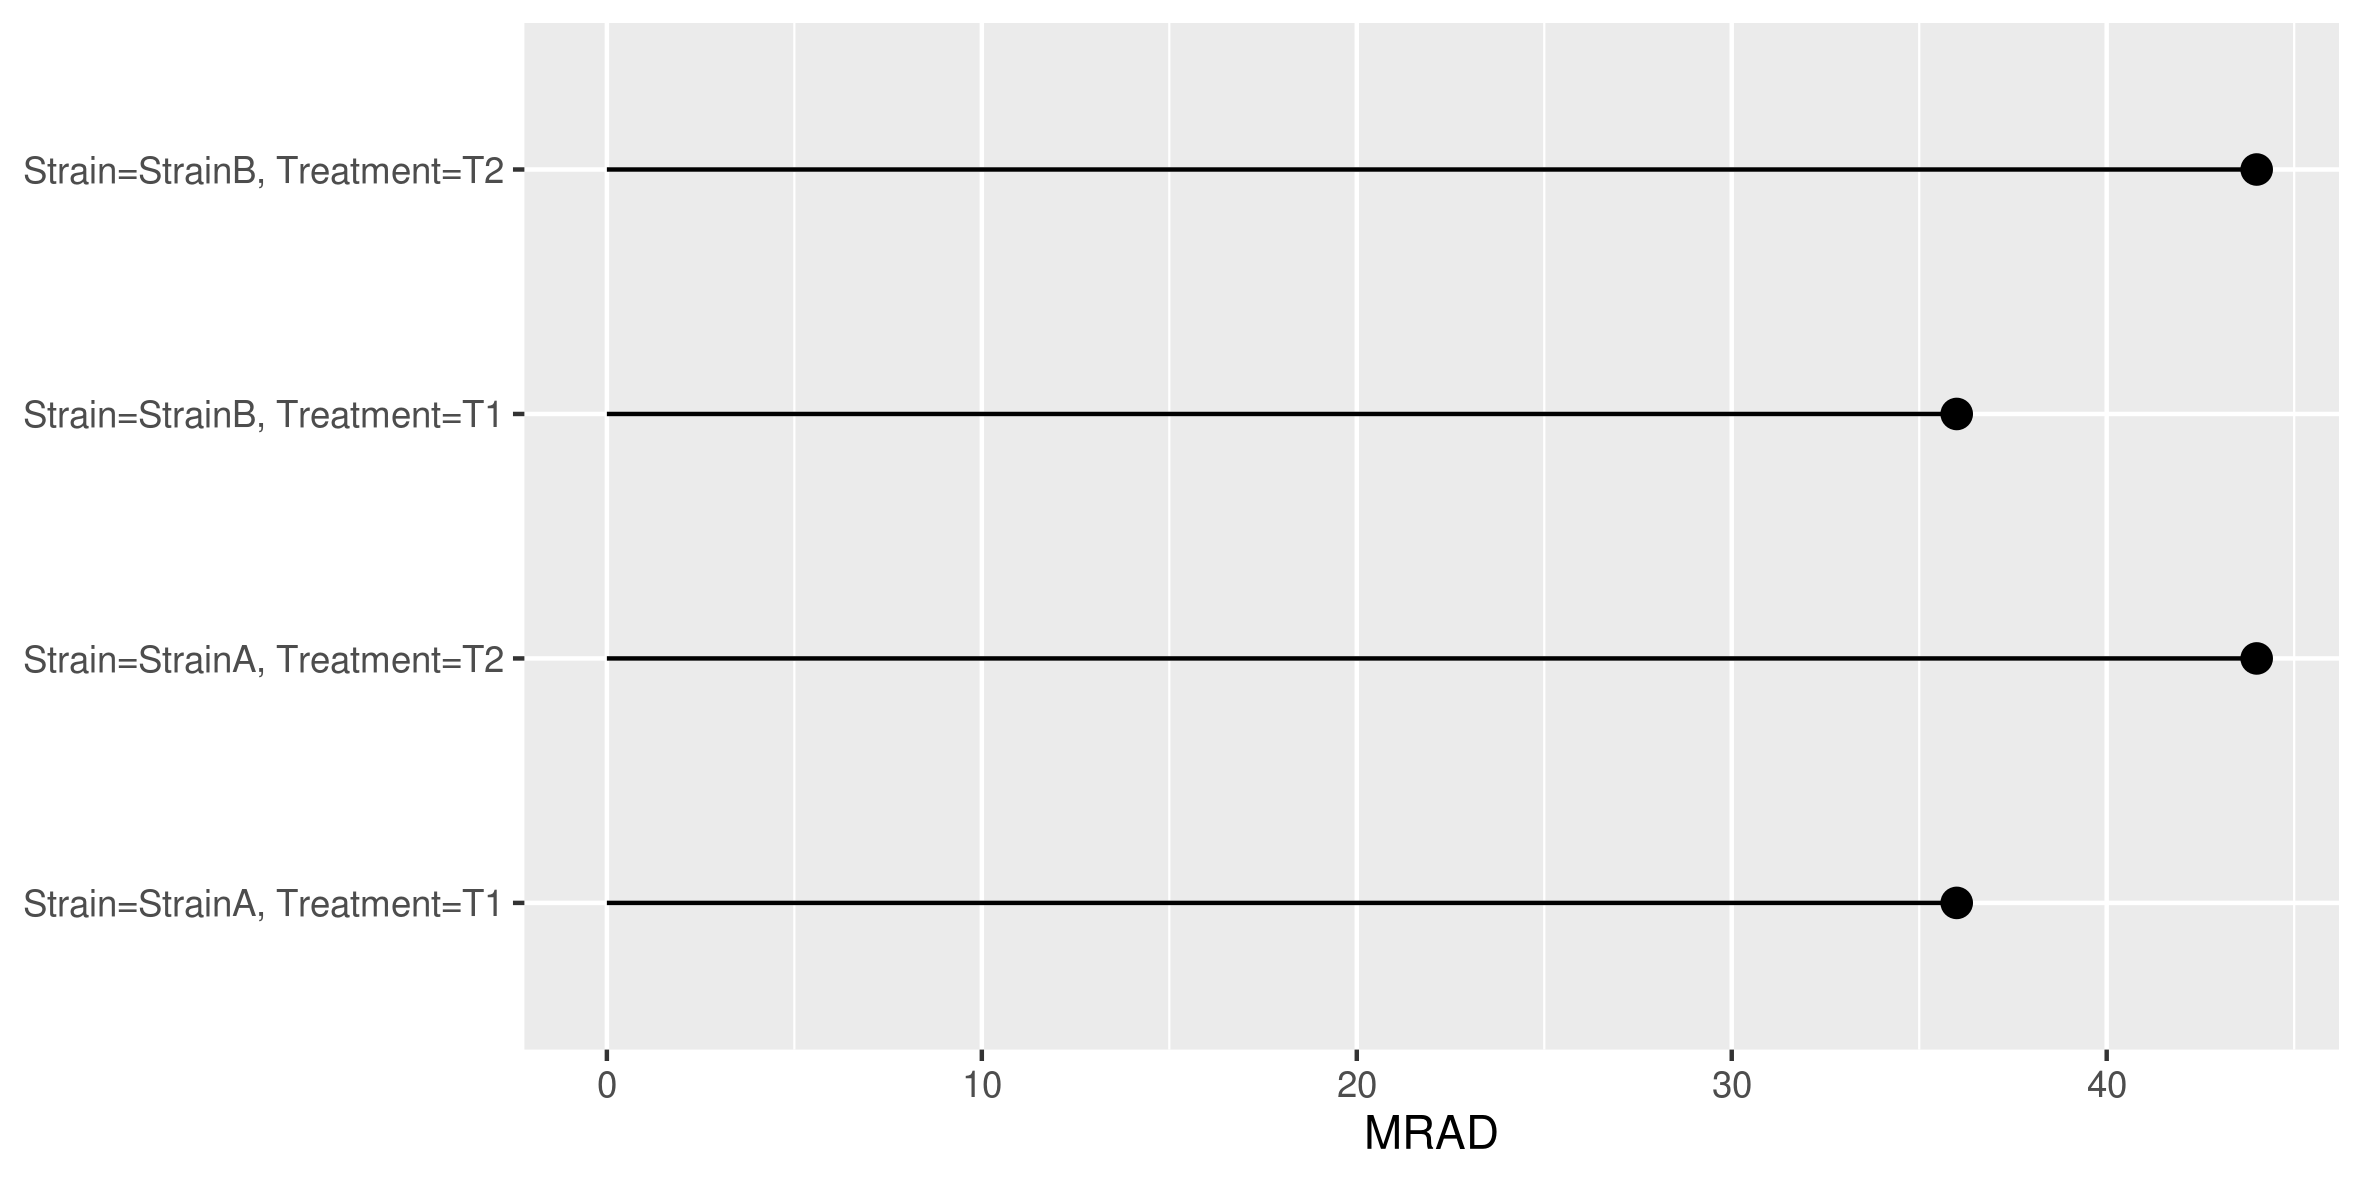
The maximal reported age at death (MRAD) for each experimental group:
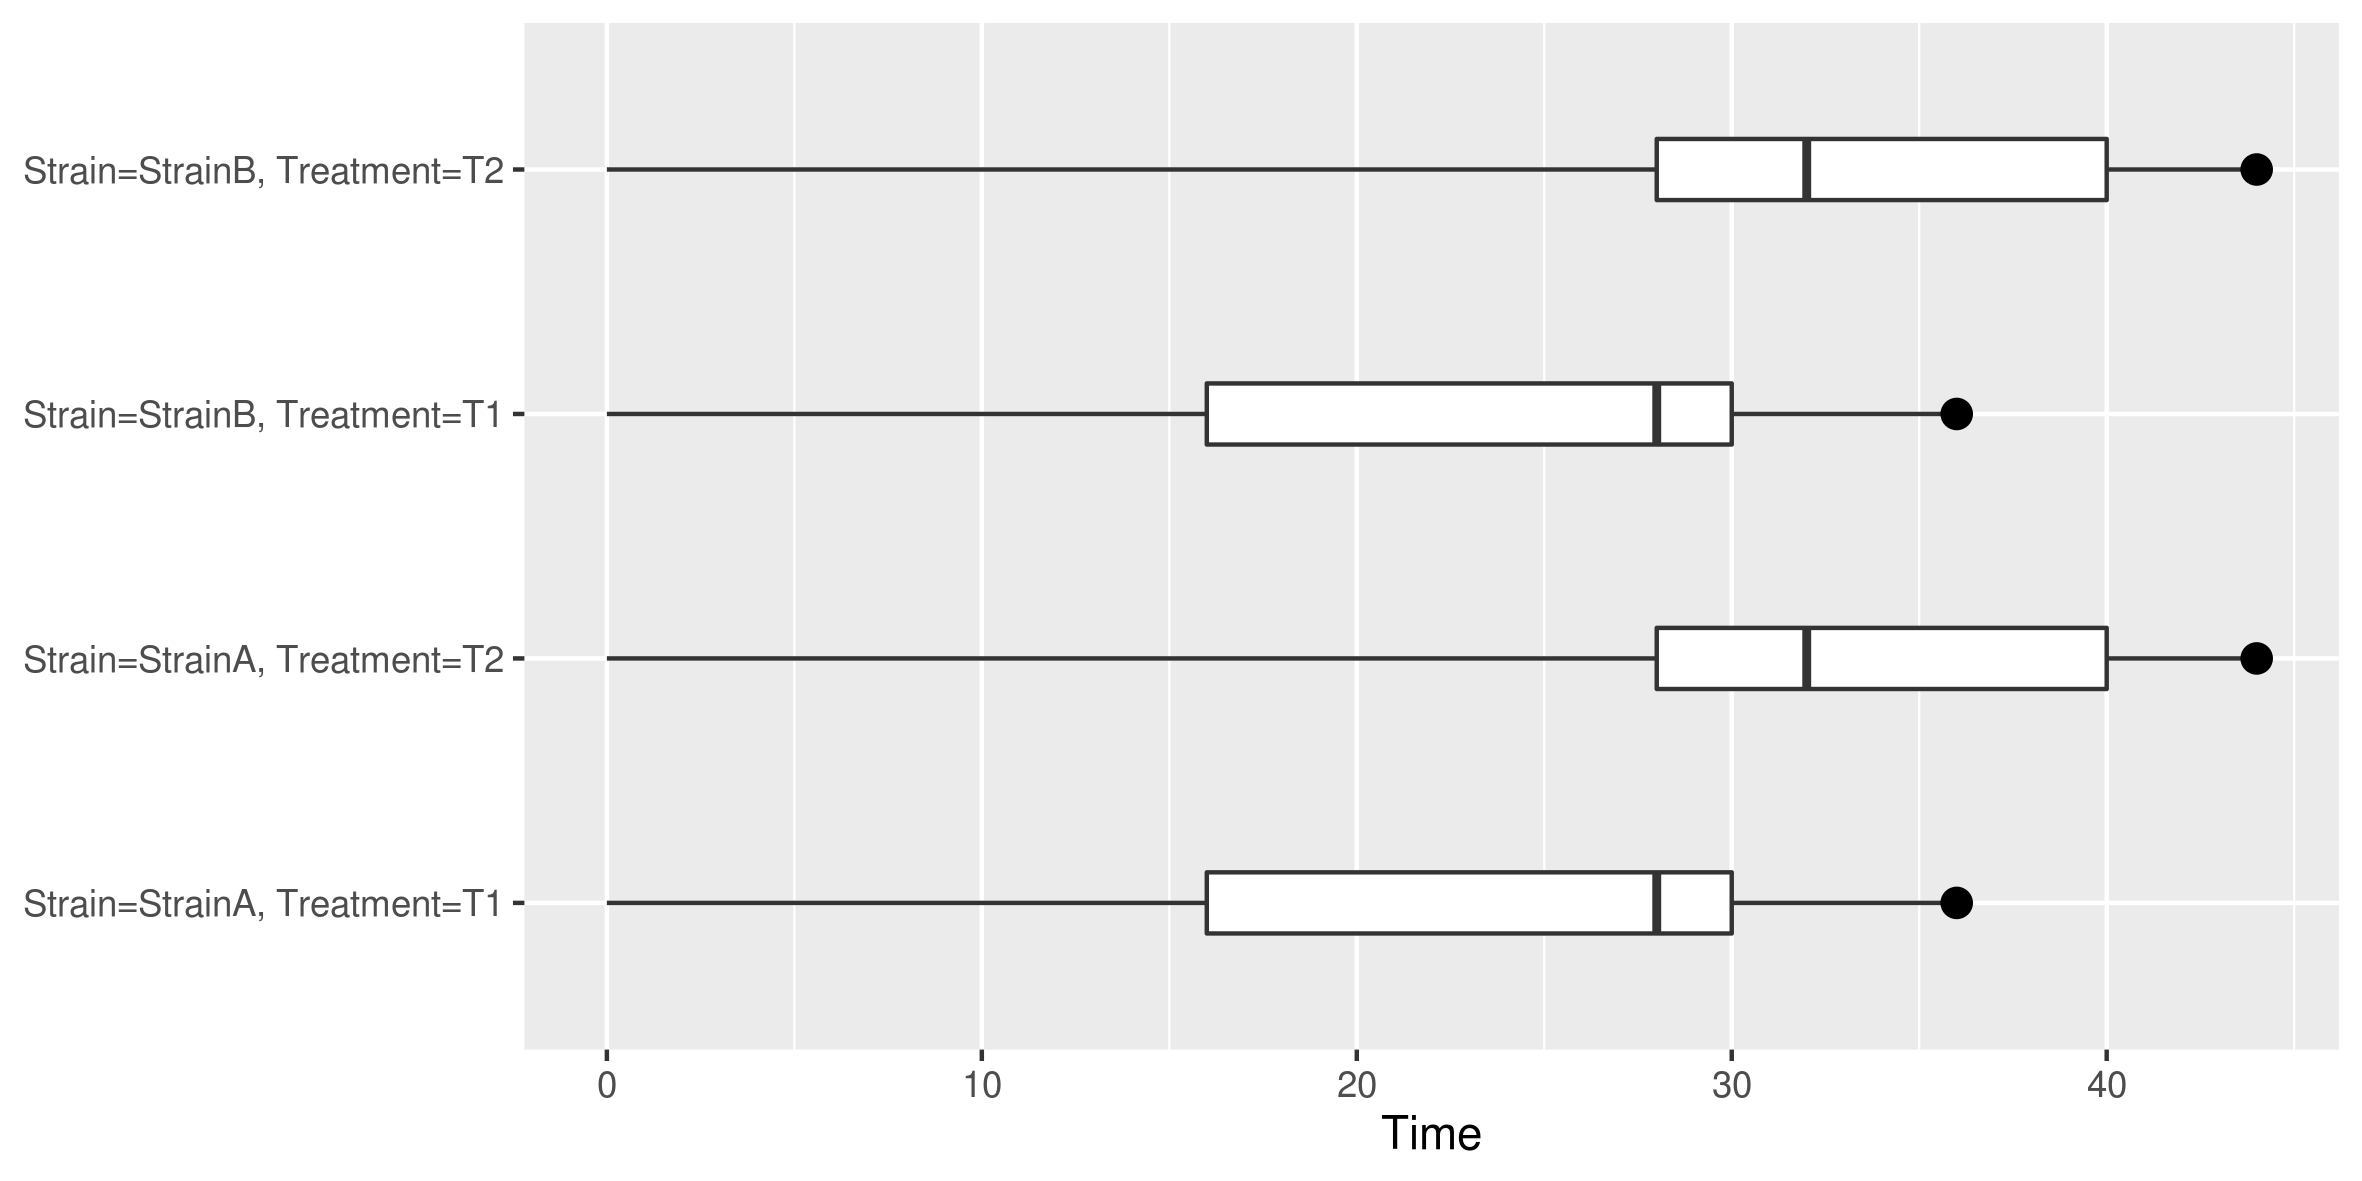
The survival time for each experimental group, with quartiles represented by boxes:
The hazard ratio analysis for each experimental condition, with a global Log-Rank test p-value:
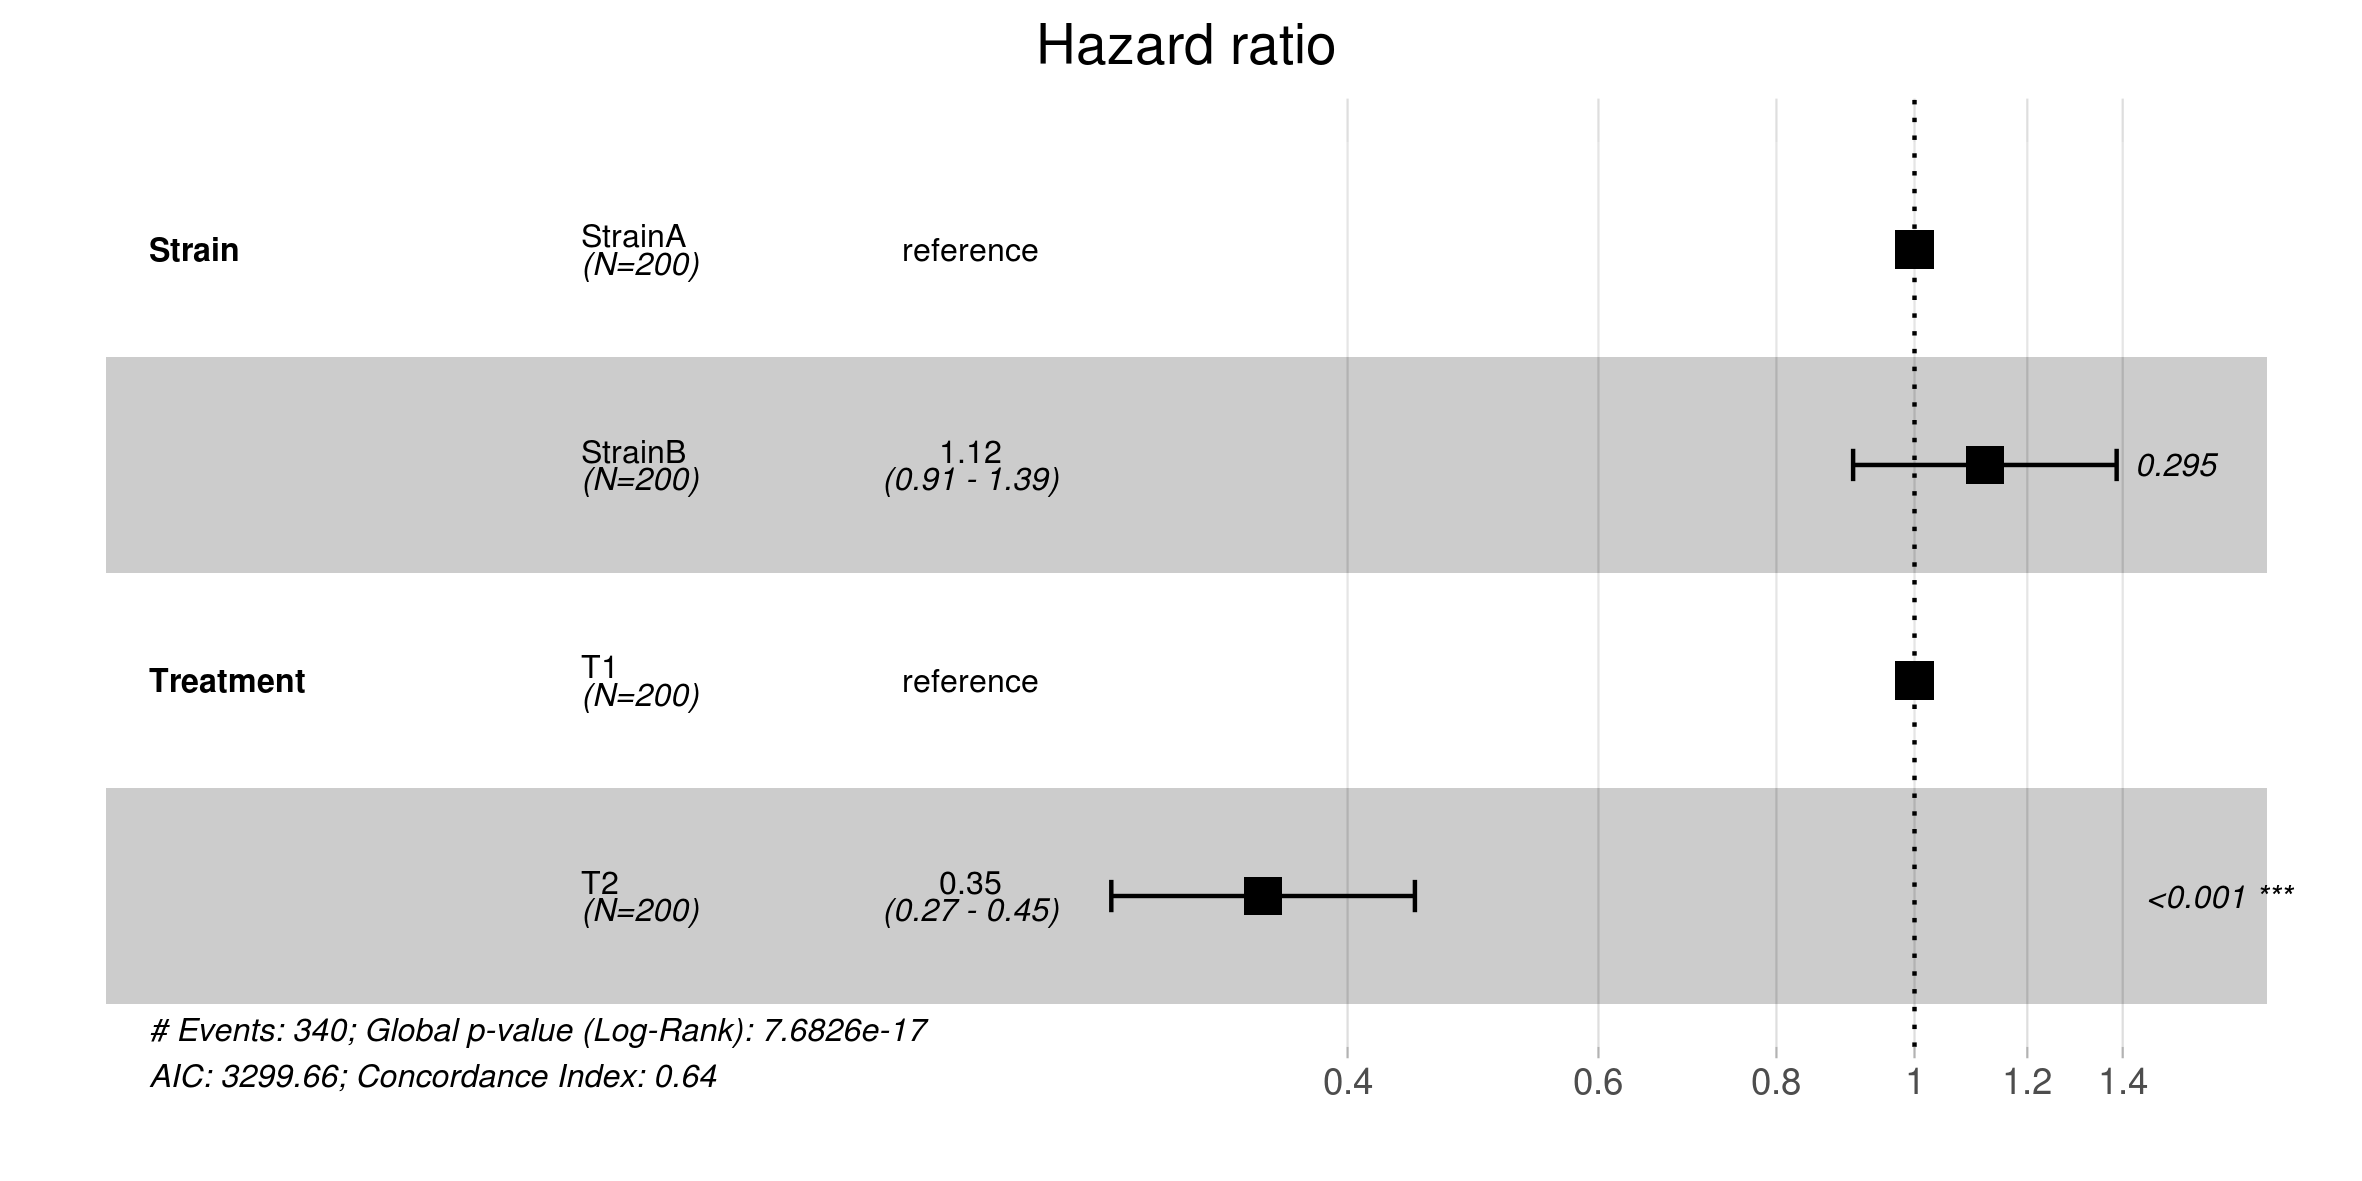
Overall, the results show that the treatment has an effect on the worms survival in both strains, while there is no significant differences in survival between the two observed strains of C. elegans.